There is currently no validated micro(mi)RNA diagnostic stool test to
screen for colon cancer (CC) on the market because of the
complexity of fecal density, vulnerability of stool to daily changes,
and the presence of three sources of miRNAs in stool (cell-free
from fecal homogenates, exsosomal miRNAs from fecal exosomes, and fecal
colonocytes). By employing earlier on a microarray
miRNA experiment, using Affymetrix GeneChip miRNA 2.0 Arrays, on
immunocaptured and enriched stool colonocytes of 15
subjects [three healthy controls and twelve colon cancer patients [three
TNM stage 0-1 (e.g., polyps 1 cm, villous or tubvillous,
or with high grade dysplasia), three stage 2, three stage 3, and three
stage 4] in triplicates, this allowed for selection of a smaller
panel of 14 preferentially expressed mature miRNAs associated with colon
cancer (12 Up-Regulated, miR-19a, miR-20a, miR-21,
miR-31, miR-34a, miR-96, miR-106a, miR-133a, miR-135b, miR-206, miR-224
and miR-302; and 2 Down-Regulated, miR-143 and
miR-145). Then carrying out an absolute quantitative digital PCR on
these 15 stool samples from TNM stages 0-4 on total small
RNA extracted by immunocapture, followed by RT that employed a Custom
TaqMan® miRNA Reverse Transcription (RT) Kit and
TaqMan RT Primer Pool, and absolute quantification of miRNAs, in
copies/μl, measured using a chip-based Absolute QuantStudio
3D Digital PCR analysis, allowed for validating the microarray results.
To ensure that human and not bacterial small total RNA was
chosen, coextraction protocols with E. coli K1 strain RS18 was carried
out, followed by comparing Agilent electrophoretic patterns
with human and bacterial electrophoretic patterns, and also random
samples were sequenced using mRNA/miRNA sequencing, to
ensure that human and not bacterial mRNA was chosen.
Quantitative dPCR miRNA data presented in herein, show that
the quantitative changes in the expression of a few mature miRNA
genes in stool, which are associated with right and left colon
cancer, would provide for a more convenient, sensitive and specific
diagnostic screening molecular markers, more useful than markers
currently available on the market, such as the low-sensitivity
(<15%) fecal occult blood test(FOBT); result in better compliance;
and is more economical than the invasive and expensive colon
cancer colonoscopy exam, resulting in a higher probability of curing
that cancer, if detected at the early TNM stages, and which becomes
incurable and deadly if not diagnosed before metastasis.
Advantages of Using a MiRNA Diagnostic Colon Cancer
Screening Test
The expression of individual genes may be altered by mutations
in the DNA, or by a change in their regulation at the RNA or protein
levels [1]. Epigenetic silencing is an important mechanism that
contributes to gene inactivation in colorectal cancer (CRC) [2].
Analysis of promoter methylation of hypermethylated in cancer 1 (HIC1) gene in human stool showed it to be highly specific (98%)
for both colon adenoma and carcinoma [3], but the sensitivity was
quite low (31% for adenoma & 42% for all cancer), suggesting that
an epigenetic marker only is not adequate for an accurate diagnostic
screening, but a combination of genetic and epigenetic markers
would be required to reliably identify CRC at an early disease
stage [4]. Working with the stable DNA has been relatively easy
compared to working with the fragile RNA molecule [1].A study by
scientists at Exact Sciences Corp, Marlborough, MA, which markets
a mutation-based DNA test “Cologuard”, assessed a newer version
of a fecal DNA test for CRC screening using a vimentin methylation
marker and another mutation DY marker plus nondegraded DNA
in a limited sample of 44 CRC patients and 122 normal controls [5].
It cited a sensitivity of 88% and a specificity of 82%, only for
advanced cancer, but not for the early adenoma stage. Besides,
DNA mutation tests are not cost-effective, as screening for multiple
mutations is expensive because these demanding mutation tests
are not automated and are labor intensive. In addition, mutation
detection in oncogenes and suppressor genes suffers from: a) the
detection of mutations in these genes in fewer than half of large
adenomas and carcinomas, b) the detection of gene mutations in
non-neoplastic tissues, c) mutations found only in a portion of the
tumor, and d) mutations often produce changes in the expression
of many other genes [6,7]. Protein-based methods are currently
not suited for screening and early diagnosis, either because
proteins are not specific to one tumor or tissue type (e.g., CEA),
their susceptibility to proteases, current lack of means to amplify
proteins, no function is known for more than 75% of predicted
proteins of multicellular organisms, there is not always a direct
correlation between protein abundance and activity, and most
importantly because detection of these markers exfoliately often
signifies the presence of an advanced tumor stage. The dynamic
range of protein expression in minimally-invasive body fluids (e.g.,
blood) is as large as 1010. Moreover, mRNA levels do not necessarily
correlate with protein expressions.
Protein microarray studies revealed that protein expression
vastly exceeds RNA levels, and only post translationally modified
proteins are involved in signal transduction pathways leading
to tumorigenesis. There is no well-documented protein test that
has been shown in clinical trials to be a sensitive and a specific
indicator of colon neoplasia, especially in early stages [8]. A serum
proteomic study employing liquid chromatography (LC)-mass
spectrometry (MS) carried out in a non-biased fashion failed to
differentiate between individuals with large adenoma ( 1 cm)
and normal individuals [9]. Compared to nucleic acids, proteomic
research is a newer discipline; therefore, it will take considerable
time to identify and validate proteins suitable for use as clinical
markers, and resolve issues of bias and validations [10].On the
other hand, a transcriptomic mRNA approach, has been shown to
detect both adenomas and colon carcinomas with high sensitivity
and specificity in preliminary studies [1], but no randomized,
standardized, blinded prospective clinical studies have been carried
out to validate the superiority of the mRNA approach.
A study indicated that a combination of a transcriptomic
mRNA and miRNA expression signatures improves biomolecular
classification of CRC [11]. Furthermore, not only does miRNAs
regulate mRNA, but they also regulate protein expression. Two
studies have shown that a single miRNA act as a rheostat to fine
tune the expression of hundreds of proteins [12,13]. Hence, for
CRC screening, miRNA markers are much more comprehensive
and preferable to a DNA-, epigenetic-, mRNA- or a protein-based
marker [14-18]. An added advantage for the use of the stable, nondegradable
miRNAs by PCR expression, by chip-based methods,
is its being automatable, making them much more economical
and more easily acceptable by laboratory personnel performing
these assays [4]. The discovery of small non-coding protein
sequences,17-27 nucleotides long RNAs (microRNAs), has opened
new opportunities for developing a non-invasive screening test
for early diagnosis of many cancers. The latest miRbase release
22 on, March 12, 2018 [http://ww.mirbase.org] indicates the total
number of miRNAs labeled “high confidence” has increased by 168,
to 1996, than in the previous release [19].
MiRNA functions seem regulate development [20], apoptosis
[21], and specific miRNAs are essential in oncogenesis [22,23],
effective in classifying solid [24-26] and liquid tumors [27,28], and
could serve as oncogenes or suppressor genes [29]. MiRNA genes are
frequently found at fragile sites, as well as minimal regions of loss
of heterozygosity, or amplification of common break-point regions
[30], implying their involvement in carcinogenesis. MiRNAs have
potential to serve as biomarkers for cancer diagnosis, prognosis
and/or response to therapy [31,32]. Profiles of miRNA expression
differ between normal and tumor tissues (33,34), suggesting that
their expression profiles cluster similar tumor types together more
accurately than expression profiles of protein-coding mRNA genes
[33,34]. A study that examined global expression of 735 miRNAs
in 315 samples of normal colonic mucosa, tubulovillus adenomas,
adenocarcinomas proficient in DNA mismatch repair (pMMR),
and defective in DNA mismatch repair (dMMR) representing
sporadic and inherited CRC stages I-IV suggest involvement of
common biologic pathways in pMMR and dMMR tumors in spite
of the presence of numerous molecular differences between them,
including differences at the miRNA level; indicating the need to pay
attention to mismatch DNA repair (MMR) [34] .
Unlike screening for large numbers of messenger (m)RNA [1],
a modest number of miRNAs is used to differentiate cancer from
normal [35], and unlike mRNA, miRNAs in stool remain largely
intact and stable for detection [36], therefore, leading to conclude
that miRNA molecules are better markers to use for developing a
reliable noninvasive diagnostic marker screen for colon cancer
[14-18], since: a) the presence of the bacterium Escherichia coli does
not hinder detection of miRNA by a sensitive technique such
as dPCR [36], and b) the miRNA expression patterns are the same
in primary tumor, or diseased tissue, as in stool samples [35-37].
The gold standard to which the miRNA test is compared to, has
been “colonoscopy”, obtained from patients’ medical records [38].
However, because the low sensitivity guaiac FOBT is still the most
commonly used screen in annual checkups (www.cancer.org) [39],
this test should also be included for comparison with the proposed
dPCR diagnostic miRNA screening approach in human stool.
Advantages of Stool Over Other Testing Media
Stool testing has several advantages over other colon cancer
screening methods a s it is truly noninvasive and requires no
unpleasant cathartic preparation, formal health care visits, or time
away from work or routine activities [40-43]. Unlike sigmoidoscopy,
it reflects the full length of the colorectum and samples can be
taken in a way that represents the right and left side of the colon.
It is also believed that colonocytes are released continuously and
abundantly into the fecal stream, contrary to blood that is released
intermittently as in guaiac fecal occult blood test (FOBT) [39];
therefore, this natural enrichment phenomenon partially obviates
the need to use a laboratory-enrichment technique to enrich for
tumorigenic colonocytes, as for example when blood is used for
screen testing [44]. Furthermore, because testing can be performed
on mail-in-specimens, geographic access stool screening is
essentially unimpeded [4]. The American Cancer Society (ACS) has
recognized stool-based molecular testing as a promising screening
technology for CRC (www.cancer.org).
Isolation of colonocytes from stool, and comparing the Agilent
electrophoretic (18S and 28S) patterns to those obtained from total
RNA extracted from whole stool [45-47], and differential lysis of
colonocytes by RT lysis buffer (Qiagen), could be construed as a
validation that the electrophoretic pattern observed in stool (18S
and 28S) is truly due to the presence of human colonocytes, and
not due to stool contamination with Escherichia coli (16S and 23S).
Taking into account that some exsosomal RNA will be released from
purified colonocytes into stool, attempts must be made to correct
for exsosomal RNA effect [48].
MiRNA dPCR Study Design
To test miRNAs as reliable, quantitative, sensitive and specific
diagnostic biomarkers, for early non-invasive screening of colon
cancer, using absolute dPCR test, preliminary work must be
validated in a study using a nested case control epidemiology design
and employing a prospective specimen collection, retrospective
blind evaluation (Probe) of control subjects and test colon cancer
patients, as specifically delineated by the National Cancer Institute’s
Early Detection Research Network http://edrn.nci.nih.gov for
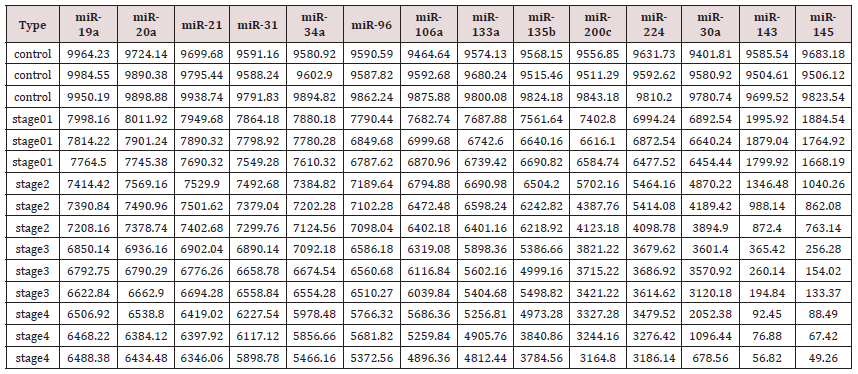
cancer biomarker discovery studies. Selection of 14 miRNAs, 12
of them showed increased expression and 2 showed decreased
expression for analysis of absolute miRNAs expression by a chipbased
digital (d) PCR test is presented in Tables 1 & 2, and Figure
1. Absolute Quantitative Digital PCR Approach Digital PCR is a new
approach to miRNAs quantification that offers an alternate method
to qPCR for absolute quantification, by partitioning a sample of
DNA or cDNA into many individual, parallel PCR reactions; some of
these reactions contain the target molecule (positive), while others
do not (negative).
Figure 1: Diagram illustrating QuantStudioTM 3D Digital PCR System Chip; ChipCase Lid (1); Digital PCR 20K 10 mm2
nanofluidic v2 chip (2), which contains 20,000 reaction wells; QuantStudioTM 3D Digital PCR Chip Case (3); Chip ID (4); Fill
port (5); and Reaction wells, the 20,000 physical holes that suspend individual PCR reactions.
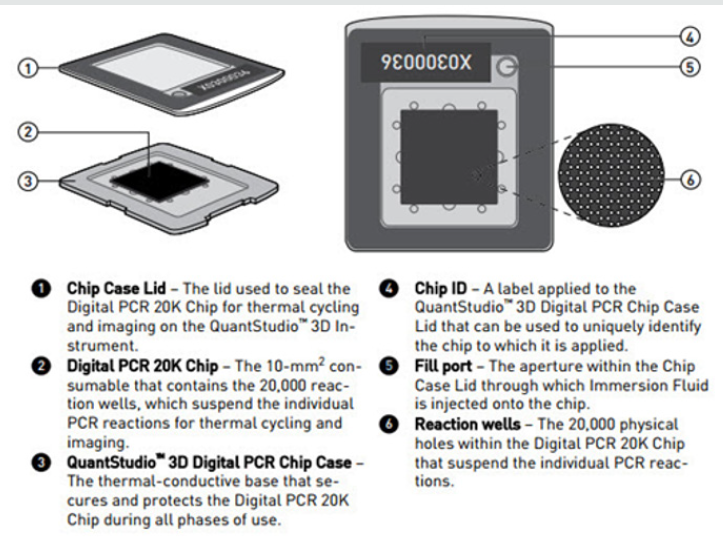
Table 1: Characteristics of Fourteen Up- or Down-Regulated MicroRNAs in Human Stool.

Table 2: Absolute Quantification of Up-/Down- Regulated miRNAs in Stool by QuantStudioTM 3D Chip-Based Digital PCR.
A single molecule can be amplified a million-fold or more.
During amplification, TaqMan chemistry with dye-labeled probes is
used to detect sequence-specific targets. When no target sequence
is present, no signal accumulates. Following PCR analysis, the
fraction of negative reactions is used to generate an absolute
count of the number of target molecules in the sample, without
the need for standards or endogenous controls. In conventional
qPCR, the signal from wild-type sequences dominates and obscures the
signal from rare sequences [49-51]. By minimizing the effect
of competition between targets, dPCR overcomes the difficulties
inherent to amplifying rare sequences and allows for sensitive &
precise absolute quantification of the selected miRNAs. Applied
Biosystem QuantStudio™ 3D instrument used in this research study,
only performs the imaging and primary analysis of the digital chips.
The chips themselves must be cycled offline on a Dual Flat Block
GeneAmp® 9700 PCR System. or the ProFlex™ 2x Flat PCR System.
The QuantStudio™ 3D Digital PCR System can read the digital chip
in less than 1 minute, following thermal cycling [45].
It allows for one sample per chip; although, duplexing allows
for analsis of two targets per chip. Sample prep for digital PCR is no
different than for real-time qPCR, when using the QuantStudio™ 3D
Digital PCR System. To figure out the concentration of cDNA stock
from results, if one includes all of the necessary dilution factors into
the AnalysisSuite™ software, the software will give the copies/μL in
the stock. There are 2 dilutions that one needs to take into account:
a) The first is the dilution of the sample in the reaction,. and
b) The second is the dilution of the stock that one makes
before adding it to the digital PCR reaction.
For example, if one wants to add 1 μL of a sample that has
been diluted 1:10 from the stock. Thus, if one adds 1 μL of his/her
sample to a 16 μL (final volume) reaction, the dilution factor of
the sample is 1:16 or 1/16 = 0.0625. Since the stock has also been
diluted 1:10 (0.1), one also need to factor this in. The final dilution
factor to enter into the software is 0.0625 x 0.1 = 0.00625 (1:160).
One can use either annotation to indicate the dilution factor in the
AnalysisSuite™ software. If one enters that value into the “Dilution”
column, the software will give the copies/μL in the starting material
(stock).
The Poisson Plus algorithm for projects that contain
QuantStudio™ 3D Chips with target, quantities >2000 copies/μL.
The Poisson Plus algorithm corrects for well-to-well load volume
variation, on a per Chip basis. This becomes important at higher
target concentrations. There is also an option to export the Chip
data as XML on the Export tab-thousands of discrete subunits prior
to amplification by PCR, each ideally containing either zero or one
(or at most, a few) template molecules [50]. Each partition behaves
as an individual PCR reactions –as with real-time PCR-fluorescent
FAM probes [or others, as VIC fluorescence]. Samples containing
amplified products are considered positive (1, fluorescent), and
those without product –with little or no fluorescence (i.e., are
negative, 0). The ratio of positives to negatives in each sample is the
basis of amplification. Unlike real-time qPCR, dPCR does not rely on
the number of amplification cycles to determine the initial amount
of template nucleic acid in each sample, but it relies on Poisson
Statistics to determine the absolute template quantity.
The unique sample partitioning step of dPCR, coupled with
Poisson Statistics allows for higher precision than both traditional
end point PCR. and qPCR methods; thereby allowing for analysis
of rare miRNA targets quantitatively and accuratley [47,48]. The
use of a nanofluidic chip, shown below, provides a convenient and
straight forward mechanism to run thousands of PCR reactions in
parallel. Each well is loaded with a mixture of sample, master mix,
and Applied Biosystems TaqMan Assay reagents, and individually
analyzed to detect the presence (positive) or absence (negative)
of an endpoint signal. To account for wells that may have received
more than one molecule of the target sequence, a correction factor
is applied using the Poisson model. It features a filter set that is
optimized for the FAM™, VIC®, and ROX™ dyes, available from Life
Technologies [46]. The chips themselves must be cycled offline on
a Dual Flat Block GeneAmp® 9700 PCR System. or the ProFlex™ 2x
Flat PCR System. The QuantStudio™ 3D Digital PCR System can read
the digital chip in less than 1 minute, following thermal cycling [45].
It allows for one sample per chip; although, duplexing allows
for analsis of two targets per chip. Sample prep for digital PCR is no
different than for real-time PCR, when using the Quant Studio™ 3D
Digital PCR System. To figure out the concentration of cDNA stock
from results, if one includes all of the necessary dilution factors into
the AnalysisSuite™ software, the software will give the copies/sL in
the stock. There are 2 dilutions that one needs to take into account:
a) The first is the dilution of the sample in the reaction,. and
b) The second is the dilution of the stock that one makes
before adding it to the digital PCR reaction.
For example, if one wants to add 1 μL of a sample that has
been diluted 1:10 from the stock. Thus, if one adds 1 μL of his/her
sample to a 16 μL (final volume) reaction, the dilution factor of
the sample is 1:16 or 1/16 = 0.0625. Since the stock has also been
diluted 1:10 (0.1), one also need to factor this in. The final dilution
factor to enter into the software is 0.0625 x 0.1 = 0.00625 (1:160).
One can use either annotation to indicate the dilution factor in the
AnalysisSuite™ software.
If one enters that value into the “Dilution” column, the software
will give the copies/μL in the starting material (stock). The
Poisson Plus algorithm for projects that contain Quant Studio™
3D Chips with target, quantities >2000 copies/μL. The Poisson
Plus algorithm corrects for well-to-well load volume variation,
on a per Chip basis. This becomes important at higher target
concentrations. There is also an option to export the Chip data
as XML on the Export tab-thousands of discrete subunits prior to
amplification by PCR, each ideally containing either zero or one (or
at most, a few) template molecules [47]. Each partition behaves as
an individual PCR reactions –as with real-time PCR—fluorescent
FAM probes [or others, as VIC fluorescence]. Samples containing
amplified products are considered positive (1, fluorescent), and
those without product –with little or no fluorescence (i.e., are
negative, 0). The ratio of positives to negatives in each sample is the
basis of amplification. Unlike real-time qPCR, dPCR does not rely on the
number of amplification cycles to determine the initial amount
of template nucleic acid in each sample, but it relies on Poisson
Statistics to determine the absolute template quantity.
The unique sample partitioning step of dPCR, coupled with
Poisson Statistics allows for higher precision than both traditional
and qPCR methods; thereby allowing for analysis of rare miRNA
targets quantitatively and accuratley [47]. The use of a nanofluidic
chip, shown below, provides a convenient and straight forward
mechanism to run thousands of PCR reactions in parallel. Each
well is loaded with a mixture of sample, master mix, and Applied
Biosystems TaqMan Assay reagents, and individually analyzed to
detect the presence (positive) or absence (negative) of an endpoint
signal. To account for wells that may have received more than one
molecule of the target sequence, a correction factor is applied using
the Poisson model. It features a filter set that is optimized for the
FAM™, VIC®, and ROX™ dyes, available from Life Technologies
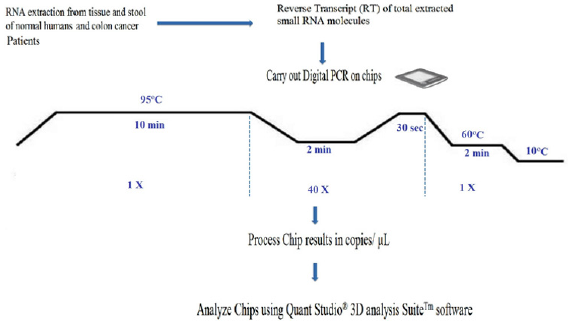
[46]. A workflow of the dPCR procedure by the QuantStudioTM 3D
Digital PCR System is presented in (Figure 2) Workflow of a digital
miRNAs PCR for colon cancer profiling in human colon tissue or
stool samples.
Figure 2: Workflow of a digital miRNAs PCR for colon cancer profiling in human colon tissue or stool samples.
Digital PCR, however, has Several Tips to Follow:
i. A rough estimate of the concentration of miRNAs of
interest has to be first carried out, in order to make appropriate
dilutions, so that not too many partitions will get multiple
copies that prevent accurate calculation of the copy number of
miRNAs of interest;
ii. Non-template controls and a RT negative control must be
set up for each miRNA, when using a “primer pool method” for
retro-transcription;
iii. A chip-based dPCR method requires less pipetting
steps, which reduces potential PCR contamination compared
to another type of dPCR marketed by Bio-Rad Laboratories,
thus called “Bio-Rad’s droplet digital PCR”, which requires
multiple pipette transfers that potentially increase the risk of
contamination [47], and
iv. Quant StudioTM 3D chip has 20,000 fixed reaction wells,
whereas Bio-Rad’s droplet PCR relies upon the generation of
droplets;
a step that could be extremely variable, as reported by
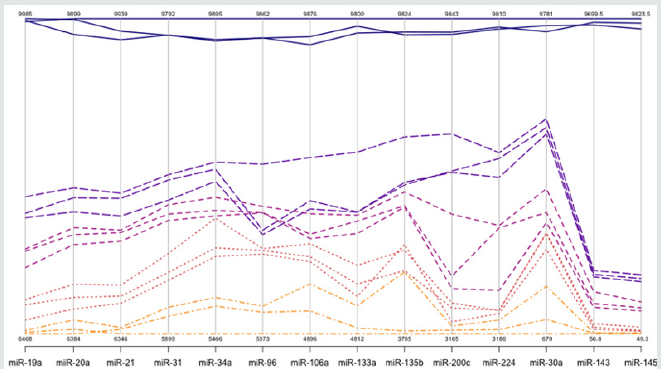
Miotto et al (11,48) Absolute dPCR data tabulated in Tables 1 &
2, and presented graphically in Figure 1 below, which show 14
preferentially expressed mature miRNAs associated with colon
cancer (12 Up-Regulated, miR-19a, miR-20a, miR-21, miR-31, miR-
34a, miR-96, miR-106a, miR-133a, miR-135b, miR-206, miR-224
and miR-302; and 2 Down-Regulated, miR-143 and miR-145) in
stool samples from healthy controls, and stages 0-1 to 4 individuals
with colon cancer . Standard deviations (sd) obtained from the
one-way ANOVA, using the 5 level factor Type (normal, stage01,
stage2, stage3, stage4) were calculated. The adjusted R-squared
values representing the proportion of variation explained by Type
are also reported. Type was statistically significant for every gene;
all p-values were less than 0.000001 (no adjustments for multiple
comparisons). These data are tabulated in Table 3 and shown
graphically in Figure 1. For each gene on the graph in Figure 1, the
min and max have been shown, in order to make the presentation
clearer. At top left is high exxpression Value of 9985, which is the
maximum value for that gene, at the bottom one finds the value for
the minimum the colors range from dark blue (control) to orange
(stage 4).
Table 3: Representation of SDs and R2 for miRNAs tested by absolute digital PCR.

The groups are also distinguished by line type: control (solid),
stage 0-1 (long dash), stage 2 (dash), stage 3 (dot), stage 4 (dash
nd dot). The figure is a parallel coordinate plot made in R, using
the package MASS. For statistical analysis. Innovation and Clininical
Significance of the dPCR-miRNA Diagnostic Stool Screening
Approach Innovation lies in the collective use of many methods, such
as: immunoparamagnetic beads to capture colonocytes from the
harsh, noninvasive stool environment, whose extracted fragile total
small RNA is stabilized shortly after stool excretion by commercial
kits so it does not ever fragment, followed by standardized analytical
quantitative miRNA dPCR-chip profiling in stool samples, which are
neither labor intensive, nor require extensive sample preparation,
to develop a panel of few stable miRNAs for absolute quantitative
diagnostic screening of early sporadic colon cancer (stage 0-1),
cheaper, with higher sensitivity and specificity than any other colon
cancer screening test on the market . Isolation of colonocytes from
stool samples is needed to provide a quantitative estimate of how
our proposed miRNA method performs. Although we may miss
exosome RNA, a parallel test could also be carried out on miRNAs
obtained from stool samples to compare the extent of loss when
colonocytes are only used, and an appropriate correction for
exsosomal loss can be made [48]. Figure 3 Absolute Quantification
of Up- or Down-Regulated miRNAs in Human Stool by Quant Studio
TM 3D Digital PCR Chip System.
Figure 3: Absolute Quantification of Up- or Down-Regulated miRNAs in Human Stool by QuantStudioTM 3D Digital PCR
Chip System.
We express our thanks to participating volunteers who provided
stool samples for the study; Dr. Paul W. Vos of the Department of
Biostatistics, East Carolina University for Statistical Analysis, and
Dr. Clark D. Jeffries at Renaissance Computing Institute, University
of North Carolina at Chapel Hill for his insight on bioinformatics’
analysis.
Read More Lupine Publishers
Surgery Journal Articles :
https://surgery-casestudies-lupine-publishers.blogspot.com/
Read More
Lupine Publishers Articles :
https://lupinepublishers.blogspot.com/